AgreeYourKPIs.ConnecttheRightSources.
Inventory sources, agree KPI definitions and reconcile data quality before building dashboards. Set role permissions, refresh targets and monitoring responsibilities around your operating budget.
Synthetic Revenue Demo
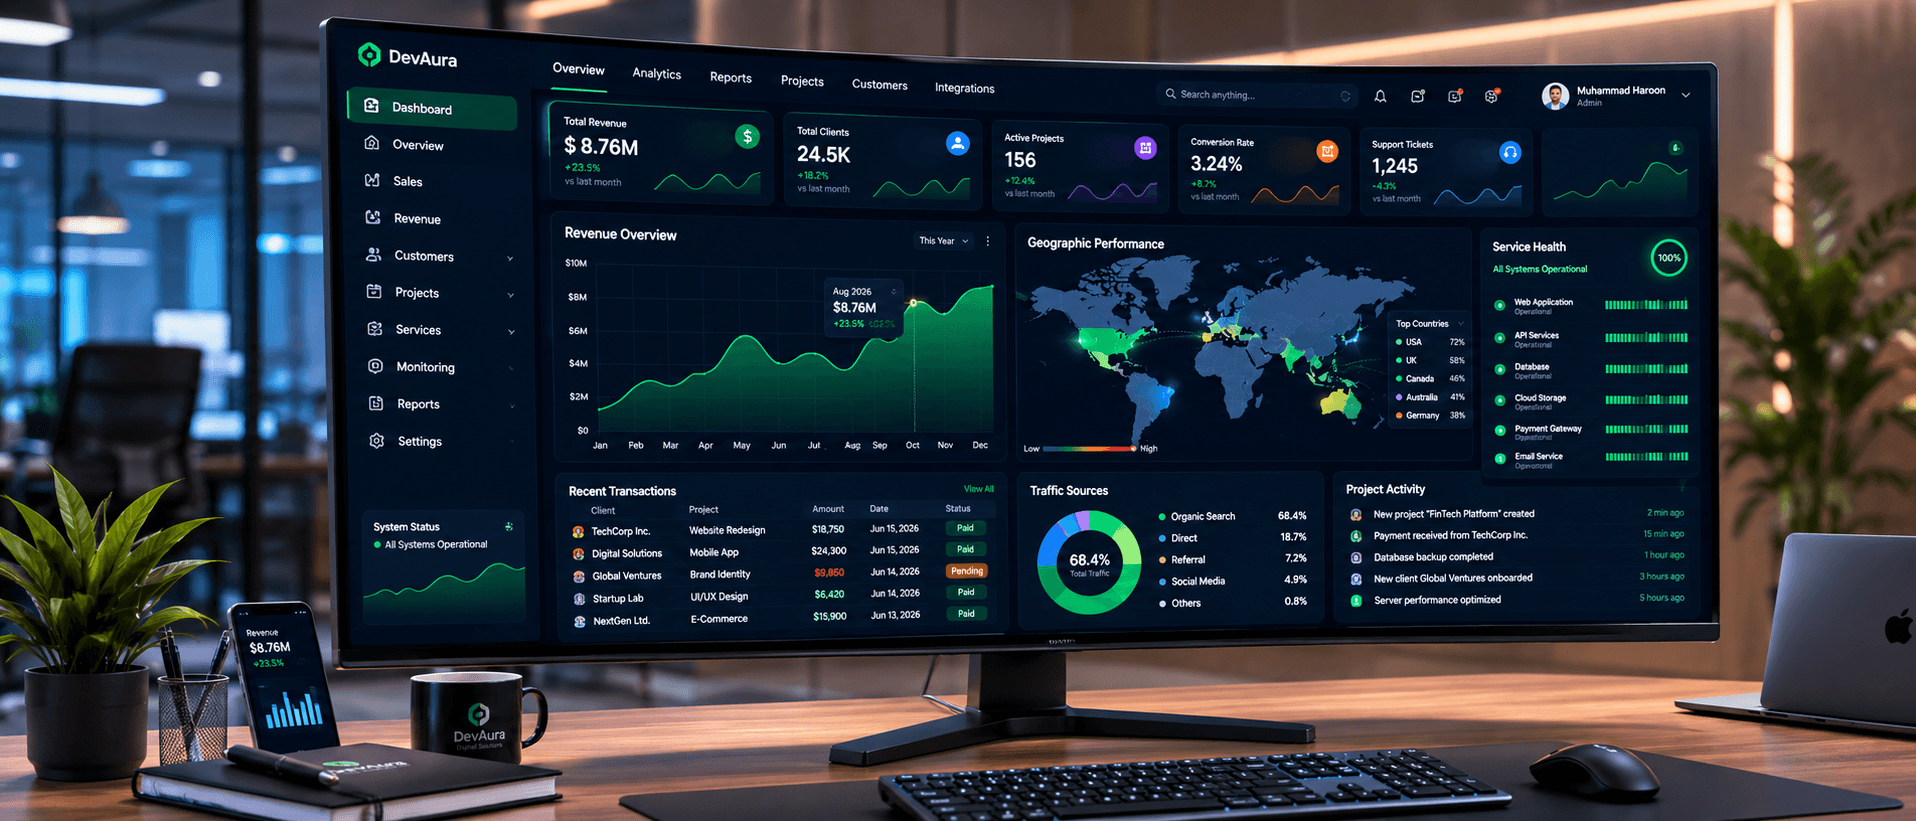
Useful Analytics Starts With Definitions
Then Reconciles the Sources
Your data right now
After DevAura
Our Analytics Services
From raw data ingestion to machine learning predictions, we build the entire data value chain.
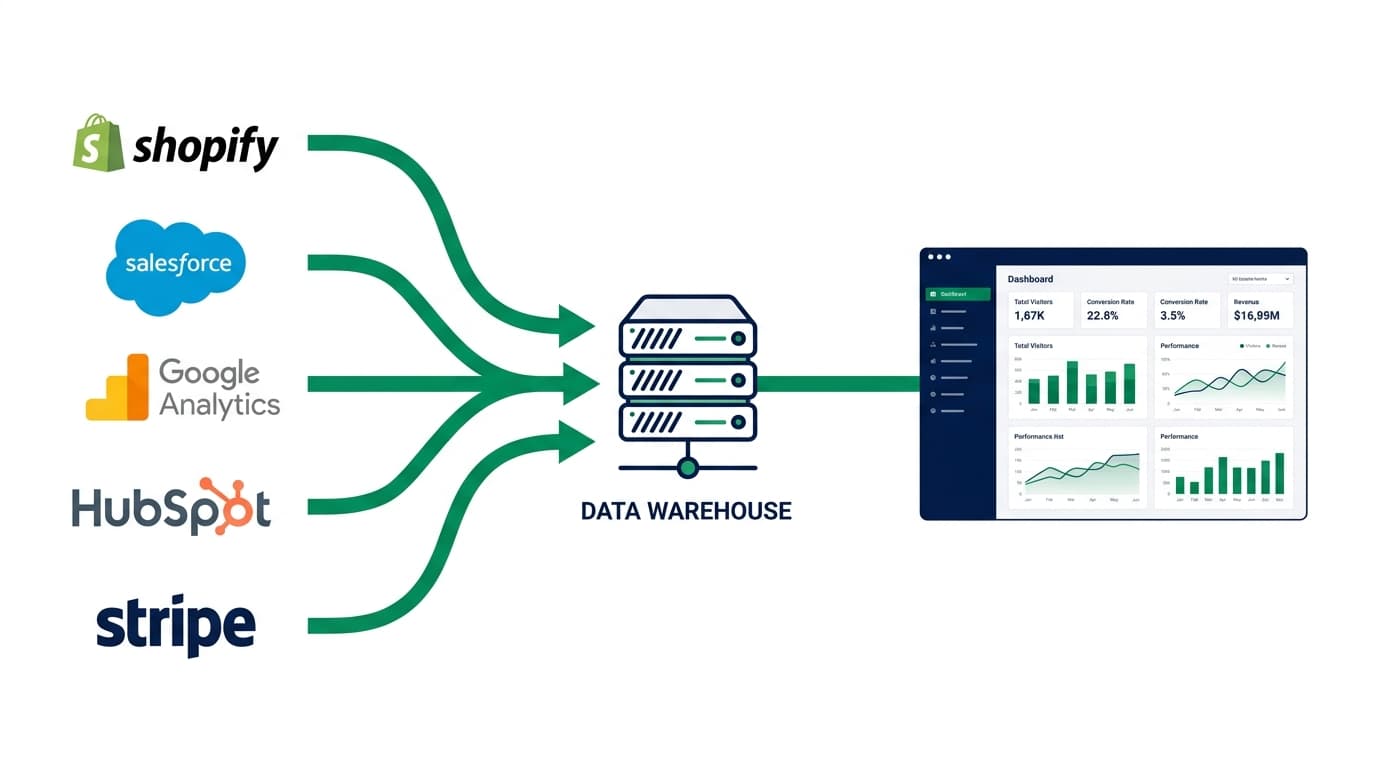
ETL/ELT Data Pipelines
Inventory authorized sources, rate limits and owners. Build monitored pipelines with retries, reconciliation, backfills and a response plan for failed runs.
Real-Time Executive Dashboards
Agree metric definitions, freshness targets and permissions. Show source timestamps and stale-data states; real-time refresh needs source support and a suitable budget.
Self-Service BI
Define a governed semantic layer, row-level access and documented dimensions. Test that self-service reports reconcile with approved totals.
Customer Segmentation & RFM
Agree permitted identifiers, consent boundaries and segment definitions. Validate cohort coverage and freshness before using segments in campaigns.
Revenue Attribution Modeling
Document identity matching, missing events and attribution assumptions. Compare models and acknowledge consent gaps; attribution estimates are not proof of causation.
Predictive Analytics Layer
Add forecasts only after baseline and holdout evaluation. Display uncertainty, version information and data limitations alongside decision support.
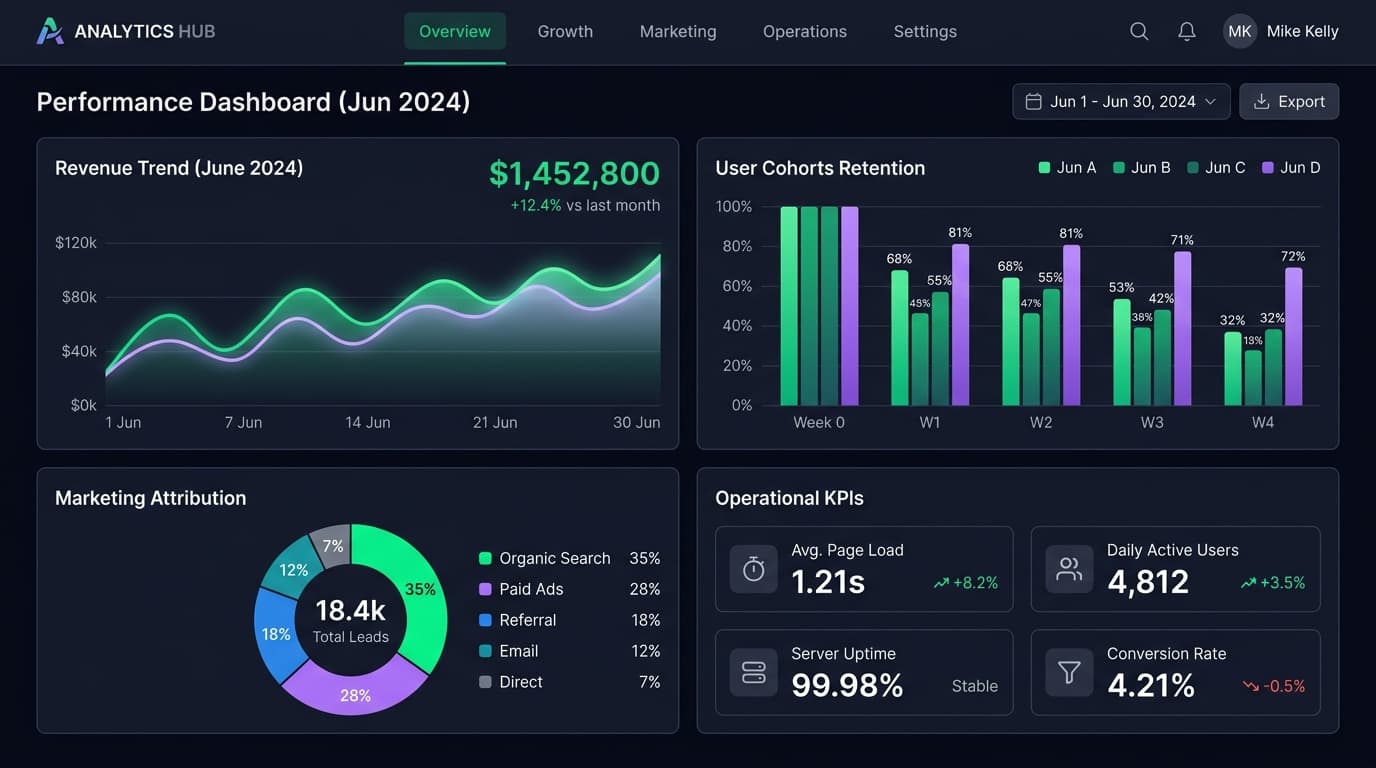
Synthetic Dashboard Preview
Illustrative tabbed mockup using synthetic data; not a live reporting system or verified client dashboard. Production drilldowns and connectors are separately scoped.
The Modern Data Stack
Select tools around source access, licensing, export needs and operational cost. Agree repository, account and dashboard ownership in the handover.
Data Warehouses
- Snowflake
- Google BigQuery
- AWS Redshift
- PostgreSQL DWH
Transformation
- dbt
- Apache Spark
- pandas
- Polars
Orchestration
- Apache Airflow
- Prefect
- Dagster
- dbt Cloud
Visualization
- Tableau
- Power BI
- Metabase
- Looker
- Apache Superset
- Custom React
Ingestion
- Fivetran
- Stitch
- Airbyte
- custom Python ETL
Real-Time
- Apache Kafka
- AWS Kinesis
- Google Pub/Sub
- Segment
Our 5-Step Implementation Process
Data Audit
Inventory sources, access rights, owners, history and quality gaps; agree a KPI dictionary and reconciliation rules.
Pipeline Architecture
Define transformations, permission boundaries, lineage and refresh targets; estimate connector, storage and query costs.
Warehouse Setup & ETL Build
Implement scoped ingestion, backfills, quality checks and alerts for failed or delayed updates.
Dashboard Design & Build
Build the agreed dashboards and test totals, filters, role access and stale-data states against approved sources.
Training & Ongoing Optimization
Handover metric definitions, pipeline code and runbooks. Agree training, alert ownership, support and change requests separately.
Design sample — illustrative quote and attribution, not verified client feedback.

"I would want the revenue definition, source timestamp and reconciliation checks visible before using a dashboard for decisions."
Frequently Asked Questions
See Your Business Clearly for the First Time.
Bring source access, KPI owners and refresh needs. Data readiness and connector scope determine cost and milestones.